Feeling like a season was extreme, and proving that it actually was extreme, are two different things. Vox Weather Meteorologist Michelle du Plessis takes a look at our recent summer season.
Let’s Look at the Data
Every summer, without fail, we hear it:
“This must be the worst summer ever.”
“It’s never been this hot.”
“I’ve never seen storms like this.”
And honestly – after a season of severe thunderstorms, flooding, heatwaves and damage – it’s completely understandable why people feel that way.
But here’s the important thing: feeling like a season was extreme and proving it was extreme are two different things. So we went back to the data – and what we found is fascinating.
Some regions genuinely did experience extreme, near-record (and even record-breaking) conditions. Others felt intense impacts without necessarily breaking long-term records.
Let’s unpack it.
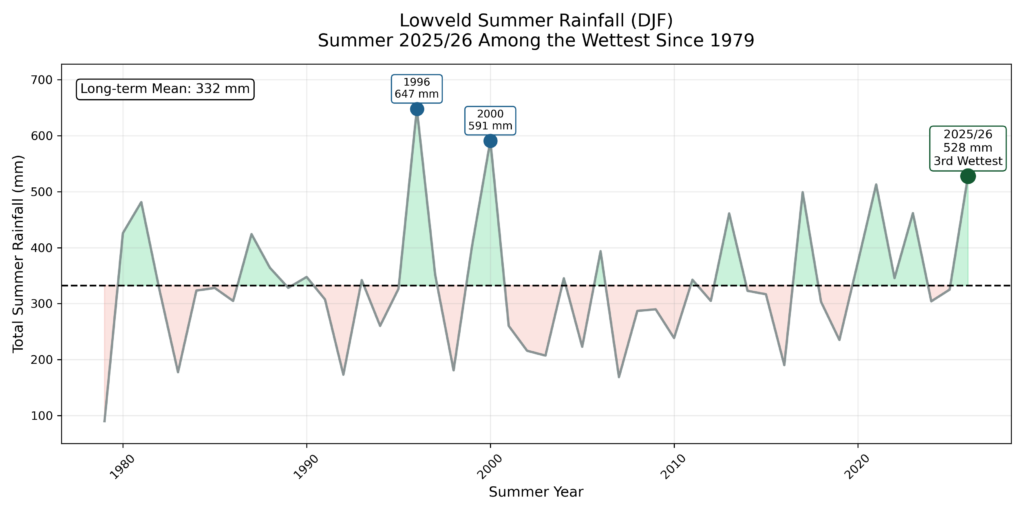
Lowveld: One of the Wettest Summers Since 1979
The Lowveld recorded 528 mm of rainfall this summer.
That’s nearly 200 mm above the long-term average of 332 mm. In percentage terms, that’s 158% of normal rainfall.
When we rank every summer since 1979, only two were wetter:
1996 (647 mm)
2000 (591 mm)
That makes summer 2025/26 the 3rd wettest summer in nearly half a century.
So if you’re in Limpopo or parts of the Lowveld and it felt relentlessly wet – that’s not just perception. The data confirms it. This was genuinely one of the wettest summers on record for the region.
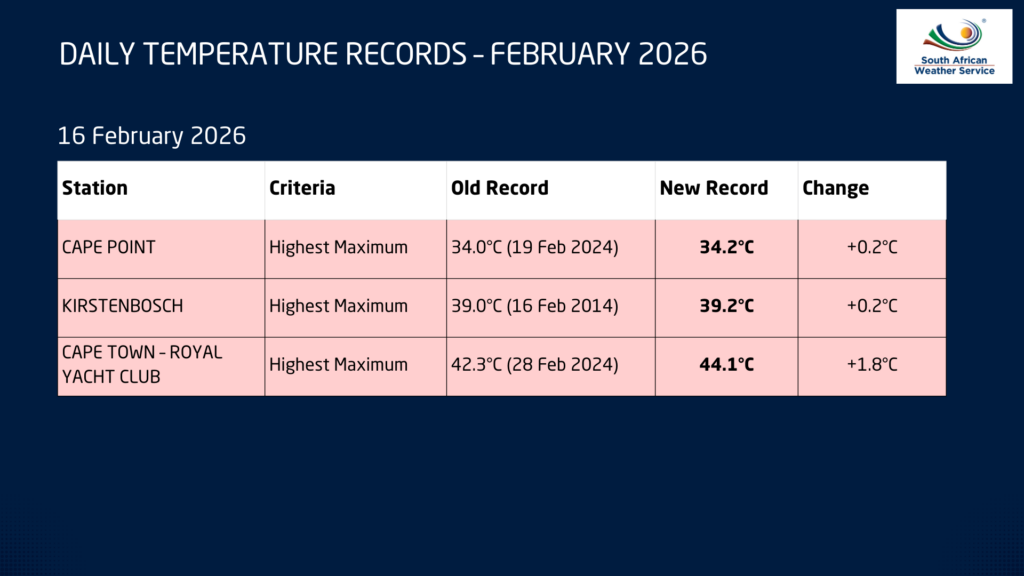
Upington: Hottest Summer on Record
Now let’s talk heat.
Upington recorded a mean summer maximum temperature of 37.36°C.
That’s +1.90°C above the 1991–2020 average.
When we ranked all summers since 1979, 2025/26 came out at number one.
Yes — the hottest summer on record in the CPC dataset.
This wasn’t just a few blistering days. It was sustained heat across the entire season. That’s what pushes a summer into record territory.
If you were in the Northern Cape and felt like this was next-level heat – the data agrees.
Richards Bay: Among the Hottest
Richards Bay didn’t break a record, but it came very close.
The mean summer maximum temperature was 30.28°C – about +1.46°C above normal.
That ranks as the 4th hottest summer since 1979.
Top four in nearly five decades is not small. It tells us this was clearly among the warmer summers on record for the region.
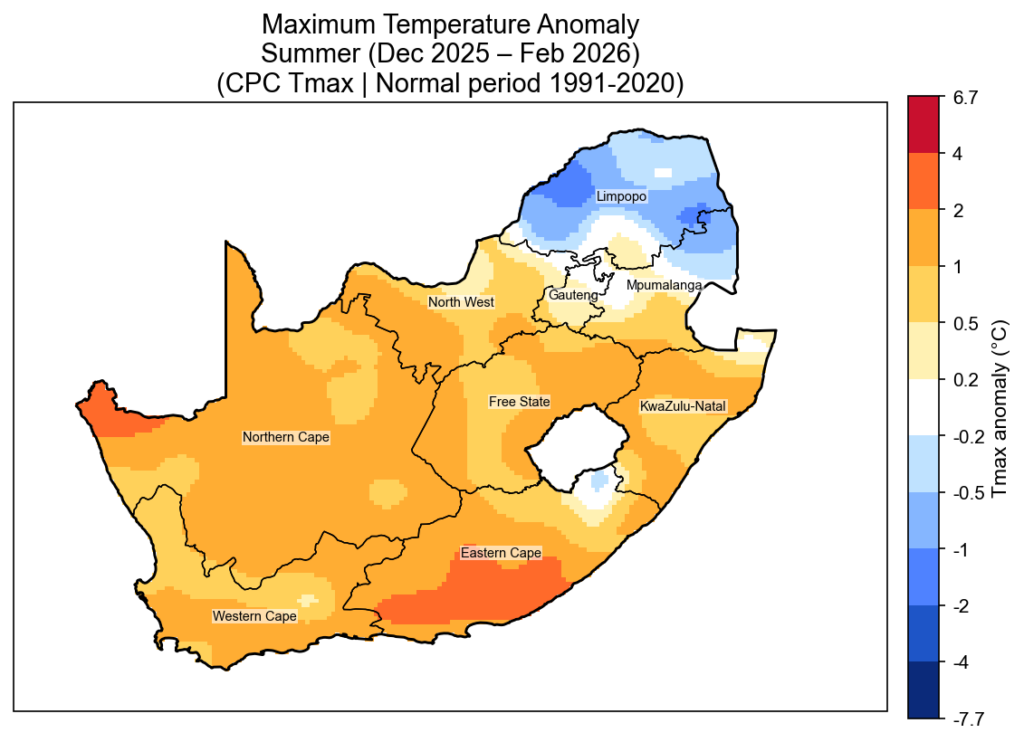
What the Temperature Anomaly Map Shows
If you look at the maximum temperature anomaly map, the story becomes even clearer. Large parts of the western and central interior are shaded in oranges and reds, indicating widespread above-normal maximum temperatures – in many areas between +1°C and +2°C above the 1991-2020 average. The Northern Cape stands out strongly, which aligns perfectly with Upington’s record-breaking summer.
Interestingly, parts of northern Limpopo show slightly cooler-than-normal anomalies. That helps explain why not every region felt the same level of heat intensity.
The map highlights something important: this was not a uniform heatwave across the country. Instead, it was a regionally amplified heat season, strongest over the western interior and parts of the Eastern Cape, while some northeastern areas were closer to average.
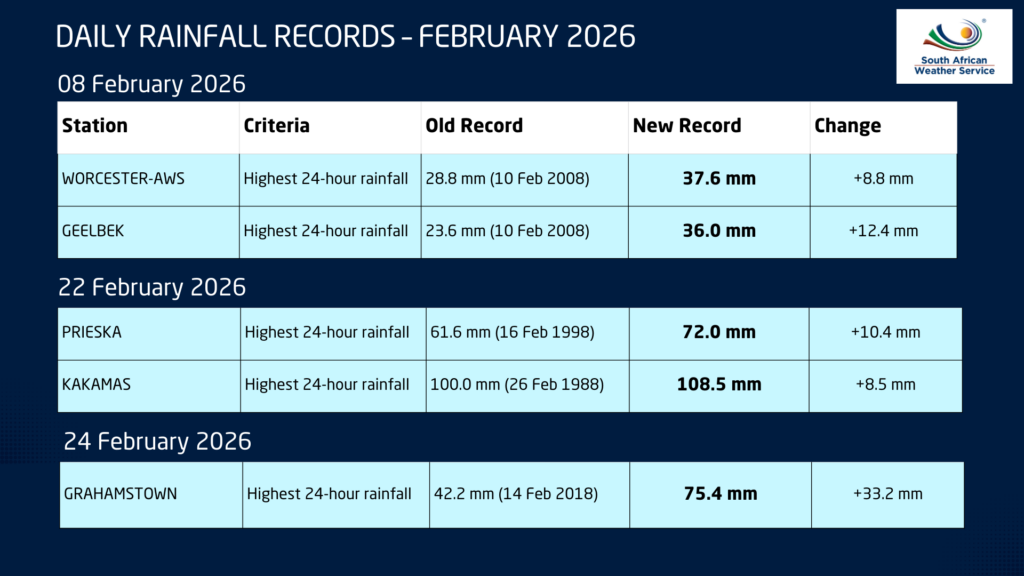
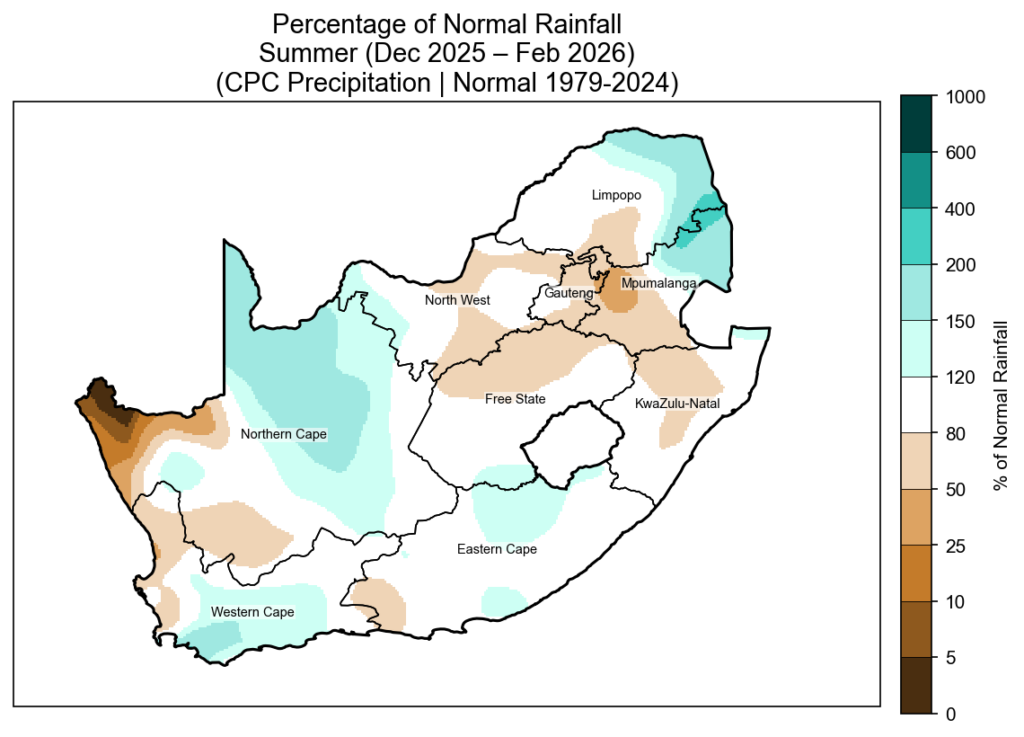
Rainfall: Below Normal in Many Areas – But Storms Were Intense
Now here’s where it gets interesting.
The rainfall map shows that many central interior regions actually recorded below-normal seasonal totals.
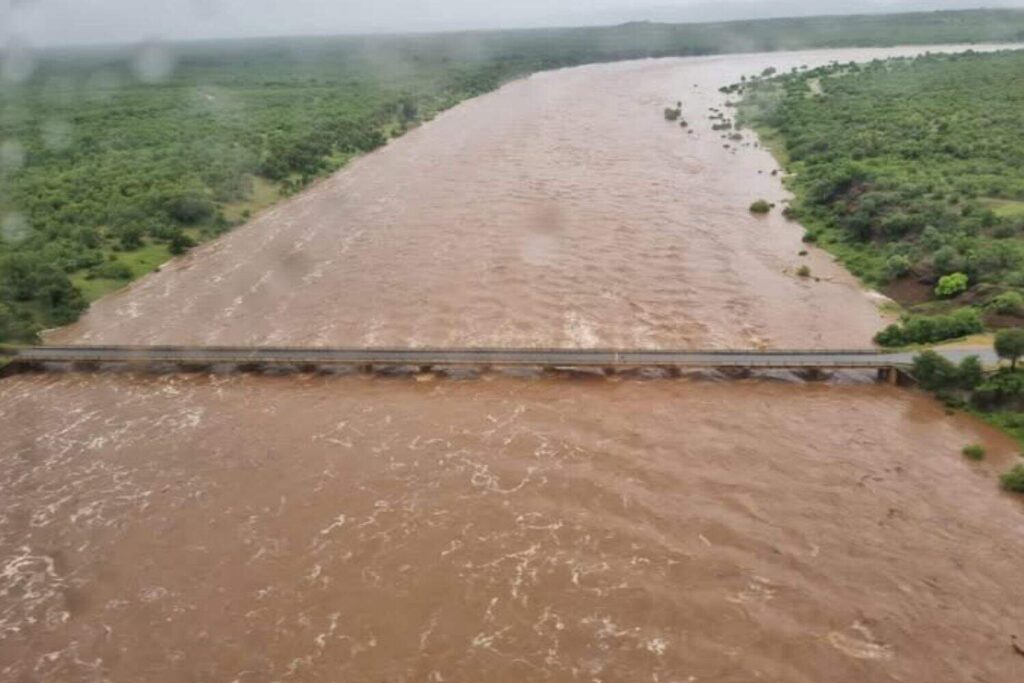
But that doesn’t mean the storms weren’t severe.
We saw multiple well-organised severe thunderstorm outbreaks this summer. There were mesoscale convective systems, large hail events, damaging winds and localised flooding.
Seasonal totals can sometimes hide intensity.
You can have:
- Fewer rainfall days
- Lower overall totals
- But more intense rainfall events
And that’s exactly what parts of the country experienced.
So when people say, “The storms were worse than ever,” they’re reacting to intensity and impact – not necessarily total rainfall accumulation.
Perception vs Reality
This is why analysis matters.
Every season feels extreme when you’re living through it. The impacts are visible. The discomfort is real. The damage is real.
But ranking and long-term comparisons help us separate perception from measurable climate extremes.
So was it “the worst summer ever”?
Not everywhere.
But in some places, it absolutely ranks among the most extreme in nearly 50 years of records.